Structured Logging Standards for Persistent Agent Runtimes
Structured logs must capture agent reasoning, not just execution traces.
Standard application logs assume a clean, deterministic world: one request comes in, one response goes out, and if something breaks, a stack trace points at the line that broke it. Agent systems, especially the persistent kind that run for hours or days across many sessions, violate that assumption at every layer. They make probabilistic decisions instead of deterministic ones, they call a variable and unpredictable sequence of tools instead of following a fixed code path, and they take unstructured natural-language input where a traditional service takes a typed request body.
The failure mode that standard logging misses entirely is the quiet one: an agent calls three tools it didn't need, discards two of them silently, and returns a confident, well-formatted, completely wrong answer. No exception fires. No error code trips an alert. The log file looks healthy. What's missing is any account of the agent's reasoning at the moment it decided, which is exactly the evidence an engineer needs when a stakeholder asks why the system was so sure about something false. Debugging this class of failure, absent structured logs built for it, generally means manually piecing together scattered logs to reconstruct a thought process that was never captured as such. That reconstruction tax is the actual cost of treating agent logging as a solved problem inherited from web services.
The three surfaces that structured agent logs must cover
AgentTrace, a structured framework for agent logging, starts from a practical constraint: instrumentation has to happen at runtime, without asking every agent author to rewrite their code, and it has to emit records that follow one schema and export cleanly to an OpenTelemetry backend. That constraint shapes the whole design, and it splits what needs capturing into three surfaces.
The cognitive surface holds the internal deliberation: raw prompts and completions, reasoning chains extracted from chain-of-thought output, confidence estimates where the model exposes them, and any structured fields the model produces, like a plan or reflection block, along with <thinking> segments when the underlying API surfaces them.
The operational surface is the execution mechanics: a span for every reasoning step, every tool call, every handoff to a sub-agent, arranged in a hierarchy so someone can walk the full decision path from start to finish rather than guessing at the order events happened in.
The contextual surface covers everything the agent touched outside itself: HTTP calls, SQL and NoSQL queries, cache reads, vector store lookups, file system access. OpenTelemetry's auto-instrumentation handles most of this by patching common libraries like requests, sqlalchemy, and redis. Agent developers don't have to hand-log every outbound call.
None of the three surfaces means much alone. A tool-call record with no cognitive context attached proves nothing after an incident, because the real question an investigator asks isn't "what tool ran," it's "what did the agent read right before it decided to run that tool." Answering that takes all three surfaces stitched together, not any one of them in isolation.
The container fallacy: why having logs is not the same as having decision-level evidence
DEMM-Bench (arXiv:2606.20634, Solozobov) tests something narrower and more uncomfortable than whether agent runtimes produce logs: it tests whether the records those runtimes produce are actually sufficient to reconstruct decision-level properties after the fact, not merely present in some log store somewhere.
Call the gap between those two things the container fallacy. It's the assumption that because a trace exists, or a ledger exists, or a schema exists, or a policy log exists, a specific governance question about a specific decision can be answered from it. Often it can't. The container is not the content.
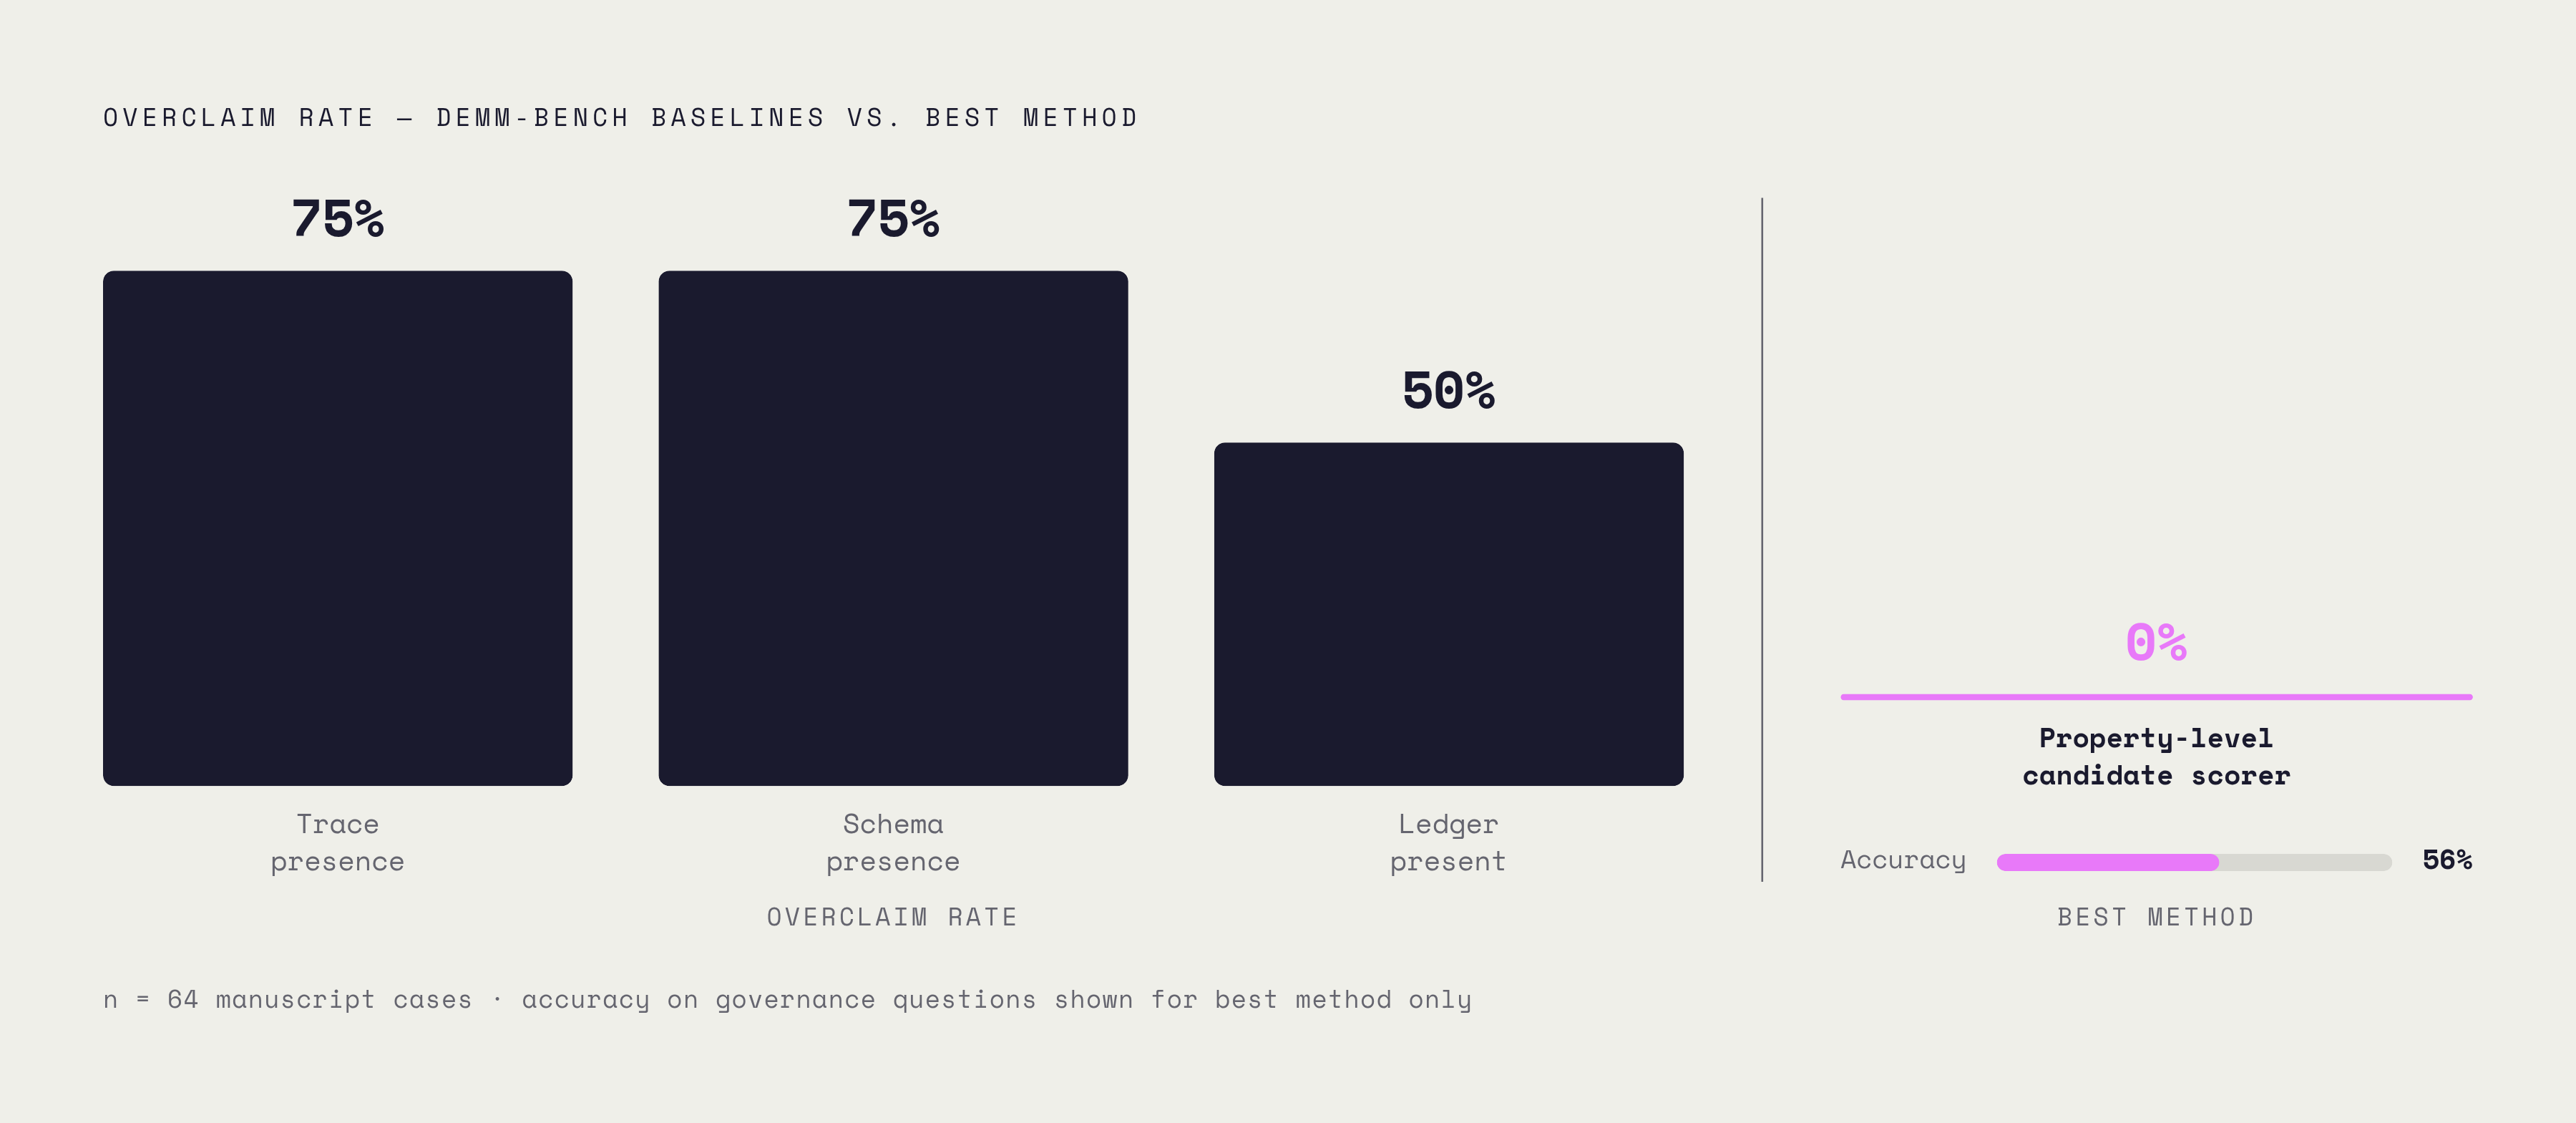
Across 64 manuscript cases, DEMM-Bench found that baselines relying on trace presence or schema presence overclaimed on 75% of cases: they asserted an answer the underlying record didn't actually support. Ledger-present baselines did somewhat better but still overclaimed on half the cases tested. The best-performing approach in the benchmark, a property-level candidate scorer, reached a mean Property Sufficiency Accuracy of 56.25% with zero overclaim. Even the strongest current method answers fewer than two out of three governance questions correctly. What it does not do, and what makes it the strongest method anyway, is pretend to answer the rest. Zero overclaim means it says "insufficient evidence" instead of guessing, which is a much harder property to achieve than raw accuracy and arguably the more important one for anything approaching an audit standard.
What a minimum viable structured log schema contains
Every record needs a correlation backbone: timestamp, agent ID, session ID, trace ID, span ID, and parent span ID. Without all six, records can't be joined back together into a coherent story, and a partial set (timestamp and session ID, say, without span lineage) leaves gaps that no amount of downstream tooling can patch.
What separates an agent log from an ordinary service log is the decision context layered on top of that backbone. The reasoning chain or thought block records why the agent picked the action it picked, which is the cognitive surface in schema form. Just as important, and easy to skip, is the delta between tools considered and tools actually invoked: a lot of failures live precisely in that gap, where an agent weighed an option, discarded it for reasons nobody logged, and picked something worse. For every tool call actually made, the schema needs the arguments passed in as JSON, the raw output returned, execution time in milliseconds, and a success or failure flag. Token usage, both prompt and completion tokens, and the model identifier belong at the per-step level rather than rolled up per session, because cost attribution and performance debugging both need that granularity. Finally, a context window or memory snapshot at defined checkpoints lets someone replay execution starting from any specific point instead of only from the beginning.
Published guides on agent production logging lay out workable structures along these lines, nesting event type, tool data, and session metadata under trace and span identifiers. Treat any one of them as a reasonable shape among several.
A log is only auditable if it lets someone recover what the agent actually read at the moment it made its decision; this is the case because that context has to be captured when the decision happens, not reconstructed later. That context has to get captured when the decision happens. Trying to reconstruct it after the fact, from adjacent logs and guesswork, is exactly the manual piecing together of context from scattered sources that structured logging exists to eliminate.
OpenTelemetry GenAI semantic conventions as the emerging common vocabulary
OpenTelemetry is the CNCF's vendor-neutral standard for collecting telemetry, and by 2026 it has become a widely adopted instrumentation layer for AI systems specifically, with auto-instrumentation packages already available for OpenAI, Anthropic, LangChain, and LlamaIndex. That coverage matters because it means a team adopting OTel doesn't have to hand-write instrumentation for each of these libraries separately.
The GenAI semantic conventions define a shared gen_ai.* attribute vocabulary: span types for agent and tool operations, and standardized fields for model name, input and output token counts, and, when a team opts in, full prompt and completion content along with tool call and result pairs.
One caveat carries real weight here. Every relevant piece of this, agent spans, client spans, MCP conventions, carries a status of "Development" in OTel's own maturity model, sitting below "Stable." Attribute names and semantics can still shift, and no stability guarantee applies yet. Adopting the convention now is reasonable, arguably necessary given how fast the ecosystem is converging on it, but it should be treated as a moving target rather than a frozen contract worth hardcoding assumptions against.
Version 1.37 made a design change. Earlier versions emitted one event per message in a multi-turn conversation. That approach flooded long conversations with a large volume of fine-grained events that were painful to query and hard to correlate against each other. The fix replaced per-message events with three aggregated attributes: gen_ai.system_instructions, gen_ai.input.messages, and gen_ai.output.messages. It's a small change on paper, but it reflects a real operational lesson: granularity that looks thorough on a whiteboard can become unusable at query time.
MCP tracing: closing the context-propagation gap between agent and tool server
MCP spread fast through 2025, and it created a specific observability problem as it did: an agent's own instrumentation produces one trace, the MCP server the agent talks to produces a separate, disconnected trace, and nothing propagates context between the two. A tool call that crosses the boundary between agent and server effectively disappears from the agent's trace the moment it crosses.
OTel v1.39 addressed this with dedicated MCP semantic conventions, adding attributes like mcp.method.name, mcp.session.id, and mcp.protocol.version.
The layering behavior here is designed to avoid duplication. Protocol-specific attributes are added to existing spans rather than generating separate parallel spans for the same execution.
The MCP specification itself now documents W3C Trace Context propagation inside _meta, locking down the traceparent, tracestate, and baggage key names so implementations agree on where this data lives. Practically, that means a trace starting inside a host application can now follow a tool call through the client SDK, through the MCP server, and through whatever that server calls downstream in turn, and the whole thing appears as one span tree in any OTel-compatible backend instead of two or three disconnected fragments.
What persistent runtimes add: log continuity across session boundaries
Three distinct problems get flattened into one phrase, "the agent runs for a long time," and they need separating before any logging design makes sense. Long-horizon reasoning is a model story: planning across many steps that depend on each other. Long-running execution is a harness story: a process alive for hours or days, invoking the model thousands of times over that span. Persistent agency is a memory story: an identity that outlives any single task and carries forward across sessions that have nothing else in common.
Research into task-completion time horizons suggests the duration problem is compounding faster than most logging architectures were built to handle.
Three walls define why this is hard. Context is finite: even a generously sized context window eventually fills, and context rot, a gradual degradation in how well a model uses everything in its window, sets in well before the hard token limit, with no upcoming context window large enough to hold a full 24-hour run cleanly. State does not persist by default: a fresh session starts blank, and Anthropic has compared this to engineers working staggered shifts where each new engineer arrives with zero memory of what happened on the shift before. Self-verification is unreliable: absent a separate evaluator checking the work, an agent can ship something half-finished with the same confidence it would show for something complete.
Multiple distinct state surfaces have to survive a session boundary, or survive a harness upgrade, for an agent to pick up where it left off without regressing, including at minimum the conversation transcript, tool-call history, and persistent memory, along with other execution and credential state. All of them matter. A logging design that only preserves the message transcript and calls it continuity is solving a fraction of the actual problem.
Checkpoint logging and the log layout for session-spanning state
LangGraph's checkpointer is the clearest working example of what this looks like in practice. interrupt() pauses graph execution, and the runtime writes the full graph state to durable storage, keyed by a thread_id that functions as a persistent cursor back into that run. Backends supported include SQLite, PostgreSQL, and Redis, so the storage layer isn't locked to one database technology.
Each checkpoint captures message history, the current execution node, tool outputs, and metadata, forming the full execution state needed to resume from that exact point.
A queryable log layout keys records by run and step identifiers, so any artifact produced along the way can be traced back to the exact point that produced it. That keying also enables differential retention: a team can apply different retention windows to detailed session logs versus final artifacts, which matters once storage cost and compliance requirements start pulling in different directions.
Temporal Workflow offers a different architecture built around the same underlying need. Agent orchestration code and individual model or tool calls are separated into distinct execution units, and workflow state is persisted in a durable event-history log, MySQL, PostgreSQL, or SQLite. The state is replayable by design, which is a different guarantee than checkpointing but aims at the same problem: making sure a long-running process can be reconstructed after the fact rather than trusted blindly.
The dual-write pattern: separating engineering observability from audit-grade evidence
The logs an engineering team needs to debug a slow tool call are not the same logs a compliance team needs to prove what an agent decided and why, and treating them as one undifferentiated stream tends to shortchange both. Engineering observability wants high-volume, granular, cheap-to-discard data: latency per span, token counts per step, error rates, the kind of thing sampled aggressively and retained for weeks, not years. Audit-grade evidence wants the opposite profile: lower volume, high fidelity, retained far longer, and structured specifically around the governance questions DEMM-Bench shows most current logs can't actually answer.
A dual-write pattern, where the same underlying event gets written once into a fast observability pipeline and once into a slower, durable, decision-focused store, is a reasonable way to serve both needs without forcing either one to compromise on format or retention. What matters is that the split is deliberate. Bolting audit requirements onto an observability pipeline after the fact tends to produce the container fallacy DEMM-Bench measured, where a trace exists, a schema looks complete, and a governance question still can't be answered from either one.
Sources
- AI Agent Production Logging: The 2026 Guide
- DEMM-Bench: A Cross-Regime Benchmark for Agent-Runtime Governance-Evidence Sufficiency
- AgentTrace: A Structured Logging Framework for Agent System Observability
- Long-Running Agents: Durability and Resumability Across Sessions — AgentPatterns.ai
- AgentTrace: A Structured Logging Framework for Agent System Observability
- dash0.com
- opentelemetry.io
- opentelemetry.io